Chat Room Moderator (wrbtrader)
wrbtrader (more info about me): http://www.thestrategylab.com/wrbtrader.htm
TheStrategyLab Reviews: http://www.thestrategylab.com/thestrategylab-reviews.htm
Phone: +1 224 307-4434
Business Hours: 8am - 5pm est (Mon - Fri)
wrbanalysis@gmail.com (24/7)
http://twitter.com/wrbtrader (24/7)
Skype: kebec2002
TheStrategyLab Free Fading Volatility Trading (FVB) Price Action Trade Strategy
Review Rating

 |
(click on image to view daily broker PnL statement)
http://www.thestrategylab.com/tsl/forum/download/file.php?mode=view&id=5145
Archive chat log @ http://www.thestrategylab.com/111506FuturesTrades.htm
Fading Volatility Breakout (FVB) Basic trade signal strategy along with the WRB Analysis Tutorial Chapters 1, 2 and 3 free study guide will help you improve your trading along with giving you an example of how to merge a trade signal with WRB Analysis. This strategy is suitable for day traders, swing traders, position traders, bar chart users or candlestick chart users. In addition, this trade strategy is applicable for stocks, exchange traded funds, futures, and forex currencies.
FVB trade signal strategy example @ https://www.forum-tsl.thestrategylab.com/download/file.php?mode=view&id=47
Further, to properly use the FVB strategy...at the minimum you want to maintain a digital documentation of your WRB Analysis in a spreadsheet or professional trade journal software (e.g. tradebench.com, edgewonk.com, tradervue.com, tradingdiarypro.com, stocktickr.com, journalsqrd.com, tradingdiary.pro, mxprofit.com or trademetria.com) because they can provide you with the quantitative statistical analysis of your trading regardless if you're trading via a simulator or real money.
You can then post your backtest results here at the forum in your private thread for me to review so that I can properly provide you support while you're using the FVB strategy or using key concepts from it with your own trade signal strategy. This is one of the best ways to determine strengths and weaknesses the FVB strategy has for you via your trading style prior to any real money trading and then again after you've begun real money trading while using one of the above recommended professional trade journal services...something you should be using with your own trade signal strategies.
In addition, this trade signal strategy will clearly show you how we communicate our trade methods to clients so that there's no misunderstandings about the objective rules and your learning responsibilities that will help prepare you to learn our fee-base Advance Tutorial Chapters or Volatility Trading Report (VTR) trade signal strategies. Further, this trade strategy will help with your due diligence prior to purchasing any of our advance trade methods.
 To Qualify For Access To The FVB Basic Trade Signal Strategy
 First of all, do not be fooled and think you can trade the Fading Volatility Breakout (FVB) trade signal strategy by viewing the above one chart example because the rules of the trade strategy are not revealed in the chart. Instead the rules of the trade strategy are only revealed to traders that qualify for access to the FVB trade signal strategy.
Therefore, to qualify for access...you need to post your trader profile, post DOKs for the WRB Analysis Free Study Guide to verify you understand the basic WRB Analysis, and post redacted screenshots of timestamp trade fills in your broker trade execution platform to verify the application of the WRB Analysis Free Study Guide merged with your trade signal strategy that you've been using prior to requesting access to our Fading Volatility Breakout (FVB) trade strategy.
The above is a quick summary and below is a more detailed explanation about how to qualify for access to our FVB trade signal strategy that are part of our vetting process to ensure we're talking to those that trade regardless if they're on a simulator or real money.
 Download the current version of the WRB Analysis Tutorial Chapters 1, 2 and 3 free study guide
 @ http://www.thestrategylab.com/tsl/forum/viewforum.php?f=119 and then learn tutorial chapters 1 and 2.
Join the TSL Support Forum (here) via registering @ http://www.thestrategylab.com/tsl/forum ... e=register  Step 1 - Post a demonstrate of knowledge (called a DOK) with anotations on your chart(s) involving the key concepts you learned from tutorial chapter 1. Specifically, your DOK must identify the WRBs and WRB Hidden GAPs as described in tutorial chapter 1. Make sure you identify all of the WRBs and WRB Hidden GAPs on your chart. If there are too many of them on your chart, use a smaller chart that contains LESS intervals instead of a big chart.
 DOK example @ http://www.thestrategylab.com/tsl/forum/viewtopic.php?f=61&t=1945
Step 2 - Post DOKs with annotations on your charts the following involving the key concepts you've learned from tutorial chapter 2: Show on your charts the key market events. DOK chart of ANY swing point price action definition discussed in tutorial chapter 2. Make sure you say specifically on your chart which swing point price action definition you're using from tutorial chapter 2 or you can title your message post via the name of the specific swing point price action definition because DOKs have one purpose...you're teaching the reader. DOK example @ http://www.thestrategylab.com/tsl/forum/download/file.php?id=1380
DOK chart of ANY strong continuation price action definition discussed in tutorial chapter 2. Make sure you say specifically on your chart which strong continuation price action definition you're using from tutorial chapter 2 or you can title your message post via the name of the specific swing point price action definition because DOKs have one purpose...you're teaching the reader. DOK example @ http://www.thestrategylab.com/tsl/forum/download/file.php?id=1385
Reminder: The "first WRB Hidden GAP" that appears at/after the key market event (KME) can only qualify as a WRB Zone if it involves any of the swing point price action definitions or strong continuation price action definitions as described in tutorial chapter 2. In contrast, not discussed in the WRB Analysis free study guide (depending up the free study guide version you have), if the key market event (KME) was extremely important to your trading instrument (e.g. FOMC Announcement key market event is very important to Treasury futures traders)...the first WRB Hidden GAPs associated with these particular KMEs are automatically designated as a WRB Zone even if they did not qualify as a swing point price action definition or strong continuation price action definition via tutorial chapter 2.
Step 3 - Post a DOK chart with annotations of WRB profit target 1, WRB Hidden GAP profit target 1 or WRB Zone profit target 1 as described in the trade management section of the free study guide. If you do not have a trade signal, you must then pretend any price area on your chart was a trade signal for the purpose of annotating the price action afterwards with WRB pt1, WRB Hidden GAP pt1 or WRB Zone pt1 as profit target. DOK example @ http://www.thestrategylab.com/tsl/forum/viewtopic.php?f=61&t=1950
Yet, if you're having problems with understanding or identifying WRBs, Contracting Volatility, WRB Hidden GAPs, WRB Zone profit targets or any other key concept from the WRB Analysis free study guide...post your questions here at the forum, post them in ##TheStrategyLab real-time chat room or send us an email with your questions.
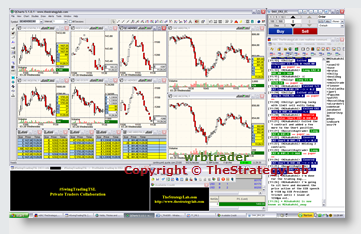
Step 4 - - Post an image of your monitor showing your most recent trades (simulator or real money) in your broker trade execution platform. Also, we must be able to see the broker trade execution platform in the image and down below in your task bar along with some executed trades...simulator or real money. Verify on a chart image the e of the shown trade fills is a strong continuation or swing point price action. Please explain one of your trades via its correlation to the WRB Zone. Simply, highlight on your chart with the WRB Zone and highlight the same chart that shows one of your shown trade fills in the broker trade execution platform...to show its correlation (sharing a tick) with the WRB Zone to verify application of the WRB Analysis Free Study Guide.
-------
Therefore, visually explain the trade via WRB Analysis on a chart and it can be a different chart than one of your DOK charts...you may post a message with the chart for further explanation but the chart must show the WRB Zone (name of the WRB Zone from chapter 2) plus highlight on the chart your exit price that correlates with the exit price shown in your broker trade execution platform.
This will verify you've learned the WRB Analysis Free Study Guide via the DOKs and it will verify your application of the WRB Analysis Free Study Guide via an explanation of any trade shown in your redacted screenshot of trade fills in broker trade execution platform.
Note: Your trade signal (entry interval) must share a tick with the WRB Zone.
-------
If you don't want others to see your image with trade explanation via WRB Analysis...please send and email to us to request a private thread for you to upload the image and we'll never share that image with anyone...no matter the reason...for security & privacy reasons.
Broker PnL Statement example @ http://www.thestrategylab.com/tsl/forum/download/file.php?id=5145
Step 5 - You must post a message post in the thread called Trader Profiles @ http://www.thestrategylab.com/tsl/forum/viewforum.php?f=127 That message post must contain information about you as a trader. You should then subject title your message post as "trader profile". Your message post (trader profile) must contain information about you as a trader as shown in the message post titled "Trader Profile Requirements" to make it easier for us to document what trading instruments the users are applying to the trade strategy and other database info about users of our free resources so that we can provide better support. Also, we'll be able to use this information to arrange user group meetings, mentoring with traders using our trade methods. In addition, we may use this database to contact specific traders after reviewing the quality of their message posts to determine whom to hire (we'll pay you) to rewrite the trade strategy in their own language.
(Note: You must post your trader profile at the above link. Thus, do not send me an email or private message that contains your trader profile. Instead, you must post your "trader profile" yourself here at the TSL Support Forum).
Step 6 - Send us an email and tell us your forum user name along with saying you want access to the Fading Volatility Breakout (FVB) trade signal strategy or you can send us a private message here at the TSL Support Forum via clicking here. We'll then verify you've qualified for access to the FVB trade signal strategy via reviewing your posted DOKs and confirming you've posted a trader profile. Next, you'll be added to the free strategy access list and we'll send you a formal email with the direct link to the Fading Volatility Breakout (FVB) trade strategy.
The FVB basic trade strategy is primarily designed for the following reasons...
Allows you to use another of our free resources to help with your due diligence prior to purchasing our advance trade methods that produce more trade opportunities than the FVB trade strategy. Advance WRB Analysis Tutorial Chapters 4 -12 or Volatility Trading Report (VTR) trade signal strategies
Allows you to learn key concepts that can be applied to your own trade strategies to help improve your strategies performance. Allows you to see how a trade signal strategy is merged with WRB Analysis via objective in-depth rules to remove as much subjectivity as possible. Allows you to see how a trade signal as discussed in basic tutorial chapter 3 is able to generate useful WRB Zones to help you trade other price actions that's different than the price action of the FVB basic trade signal. Simply, you'll learn that the price action of any trade signal you traded (FVB or your own signals) is still useful to manage other trade opportunities if the trade signal was involved as a swing point or strong continuation price action. The trade strategy will help to spark ideas of other trade strategies that you may design on your own and to add to your ability to find profitable trade opportunities in price action you typically would have not traded. Allows you to see our communication of a trade signal strategy to help you decide if you want to become a fee-base client of TheStrategyLab.com WRB Analysis is the foundation that precedes all of our trade signal strategies. Thus, you must have learned/applied the basic tutorial chapters 1, 2 prior to learning the Fading Volatility Breakout (FVB) trade signal strategy because the reliability of the FVB trade signal strategy is dependent upon basic tutorial chapters 1& 2. Also, you do not need to learn basic tutorial chapter 3 for use with the FVB trade signal strategy because the FVB strategy is already 'embedded' with WRB Analysis. Simply, basic tutorial chapter 3 is only for traders that have their own trade signal strategies along with needing our help in merging their trade signal strategies with WRB Analysis. Once again, do not use the FVB strategy without market context via the basic tutorial chapters 1 and 2 although key market events not required for use with the FVB strategies.
With that said, breakout strategies are very popular amongst independent (retail) traders that trade their own money because these strategies are commonly shared at forums, blogs and many other online social networks especially when there's discussions about support/resistance. Unfortunately, these strategies (dozens of different types of breakout price actions) are not profitable due to the fact that most breakout traders do not understand the weakness of the price action occurring as a breakout in different types of volatility market conditions. In contrast, another group of traders called institutional and veteran traders prefer to fade breakout signals because they understand the weakness of these particular types of price actions via exploiting them in particular types of volatility market conditions.
Simply, there are particular type of market conditions suitable for breakout strategies and particular type of market conditions suitable for fading breakout strategies. These types of market conditions are identifiable via key changes in volatility.
Trade Strategies are just one piece of the Puzzle It's important for you to understand that most profitable traders (including eye) understand that successful trading involves more than just entry/exit signals. If you don't understand, it's highly recommended that you read my "daily trading routine" @ http://www.thestrategylab.com/tsl/forum/viewtopic.php?f=240&t=2365
WRB Analysis Tutorial Chapters and Fading Volatility Breakout (FVB) trade strategy are applicable to all stocks, exchange traded funds, futures and forex currencies worldwide. Yet, the most common trading instruments we see the FVB trade strategy being applied to by free users and our fee-base clients are listed below: Stocks CME Micro Emini Futures MES, MNQ, MYM and M2K CME Emini Futures EMD, ES and NQ CME Emini Futures RTY (formerly known as TF on the ICE exchange) CBOT mini-sized Dow Futures YM Eurex Index Derivatives (futures) DAX and DJ Euro Stoxx50 Eurex Fixed Income Derivatives (futures) BUND, BOBL and Schatz Euronext Futures FTSE-100 and CAC-40 CME Futures EuroFX 6E and EC Treasury Futures T-Notes ZT, ZN, ZF and T-Bonds ZB Forex Currencies GbpUsd, EurUsd, EurYen, UsdCad, XauUsd and XagUsd Exchange Traded Funds VXX, DIA, IWM, QQQ, SPY, BGU, FAS, FAZ, TNA, OIH, XLE and GLD NYMEX Energy Futures Light Crude Oil CL, Brent Crude Oil BRN, e-miNY QM and Natural Gas NG COMEX Metal Futures Gold GC, mini-Gold YG, Copper HG and Silver SI S&P CNX NIFTY Futures Hang Seng Index Futures HSI and mini-Hang Seng MHI TheStrategyLab / M.A. Perry
wrbtrader / Price Action Trading
Trader and Founder of WRB Analysis (wide range body/wide range bar analysis)
a.k.a. wrbtrader (more info about me): http://www.thestrategylab.com/tsl/forum/viewtopic.php?f=127&t=850 & http://www.thestrategylab.com/wrbtrader.htm
 @ http://twitter.com/wrbtrader
  @ http://stocktwits.com/wrbtrader
  @ https://www.tradingview.com/u/wrbtrader
  @ https://www.twitch.tv/wrbtrader/
Youtube @ https://www.youtube.com/user/wrbtrader/
Flickr @ https://www.flickr.com/photos/42832721@N08/
Pinterest @ https://www.pinterest.ca/thestrategylab/
Imgur @ https://imgur.com/user/thestrategylab
TheStrategyLab @ http://www.thestrategylab.com/
Phone: +1 224 307-4434
Business Hours: 8am - 5pm est (Mon - Fri)
Skype Messenger: kebec2002 (24/7)
wrbanalysis@gmail.com